We were asked if it was possible to import data from a Google Sheet in to a webpage that would allow the user to sort the data. The idea was that staff could go on to the webpage, check their data, email any amends back to the administrators, which could then be changed on the Google Sheet and would then appear live back on the webpage.
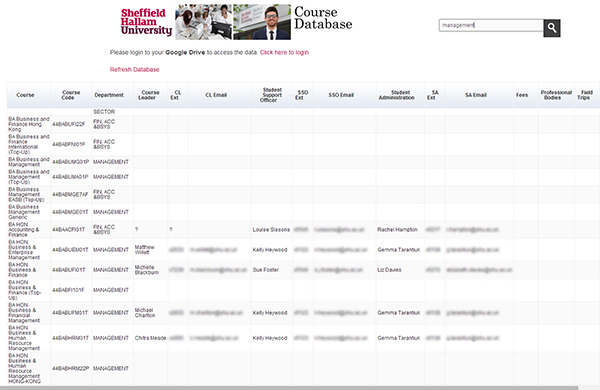
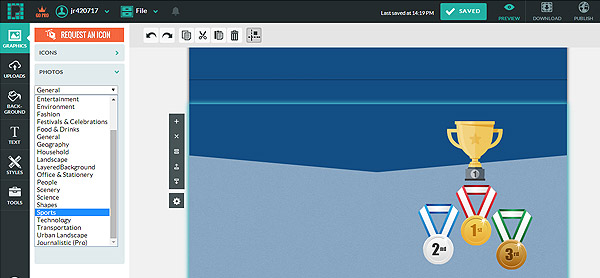
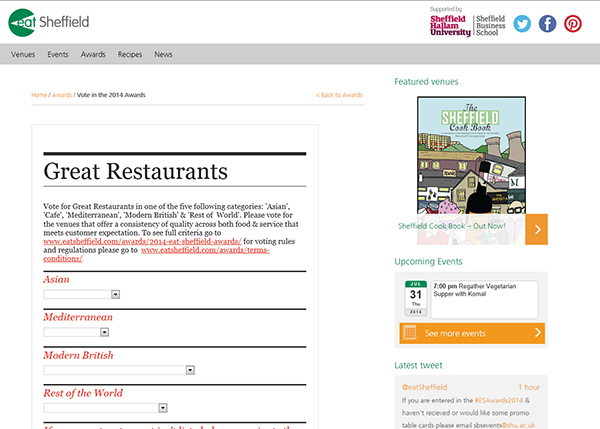
Database in a webpage
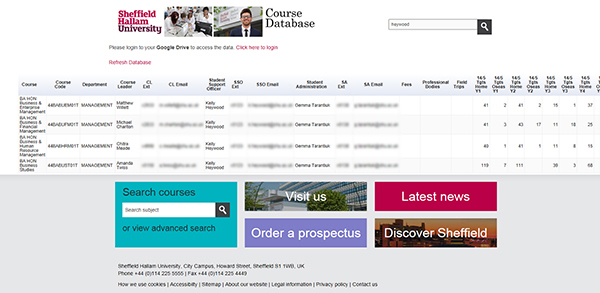
Sorted data
We found a solution someone had posted on a blog and modified it for our own use. Unlike other Google Sheet Add-ons this one requires some knowledge of HTML, the will to edit PHP and the software to edit and upload the pages to a server. It’s not for the faint-hearted, more a tutorial to refresh our own memory and show what can be done with Google Sheets.
If you want to try this yourself here goes.
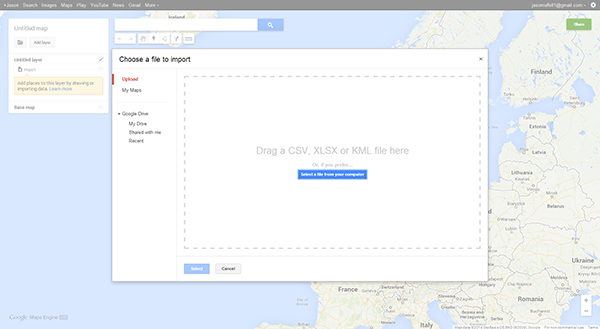
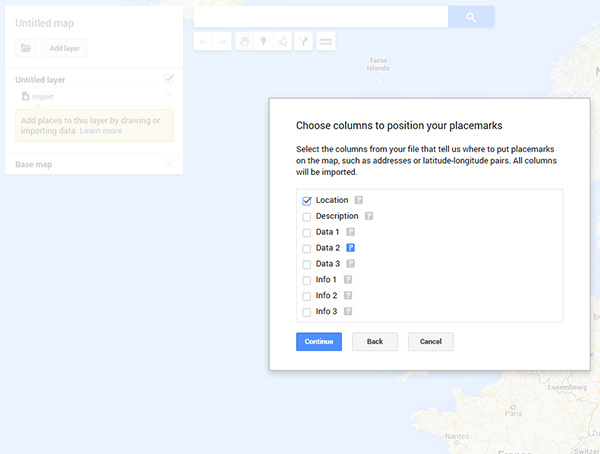
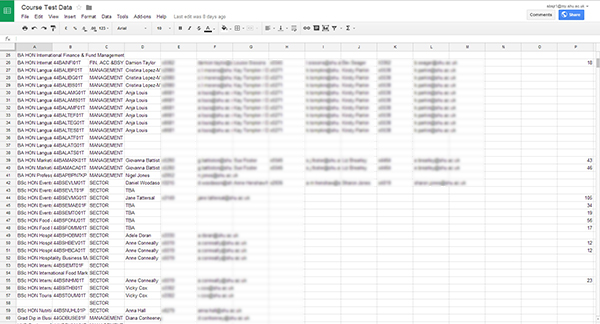
Firstly, create a Sheet on your Google Drive and import your data in to it. This may already be in an Excel document which you can just cut and paste into a Google Sheet.
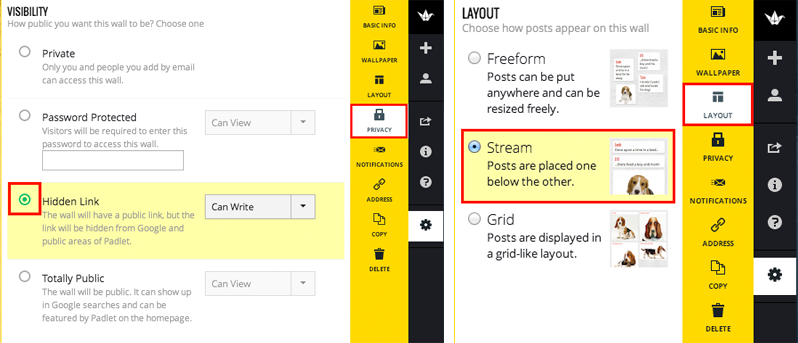
If you want the data to be visible to anyone make sure you set the sharing permissions to ‘Public’. Otherwise you will have to put a reminder on your webpage that users should be logged in to the Universities system before they can see the data.
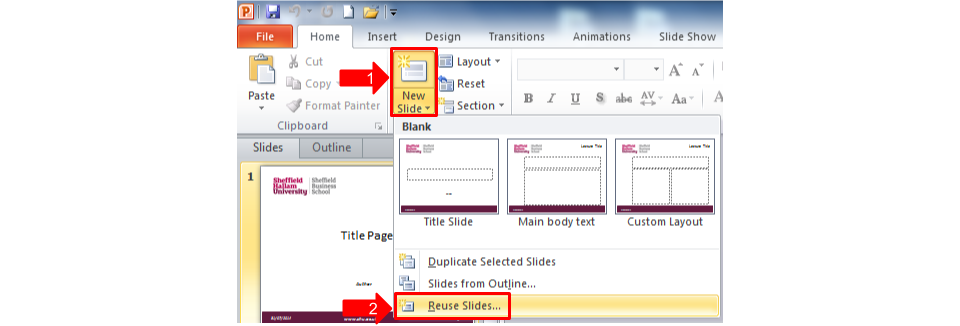
Next create a web page in a software package such as Dreamweaver. I created a framework using the code (HTML), stylesheets (CSS) and script s (js) that is used by the main University website to keep the university branding. When you have created your page, save it to your computer as a PHP file.
Remember to add a refresh button so that the full database can be reshown after a search has been made.
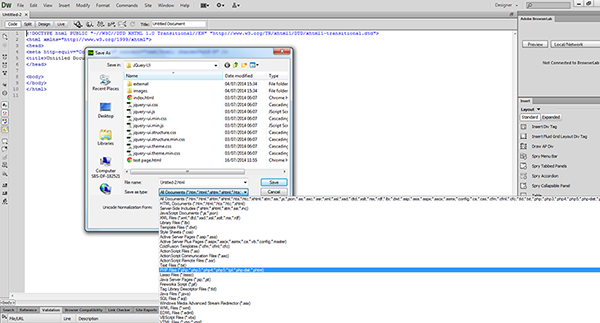
Save your file as a PHP document
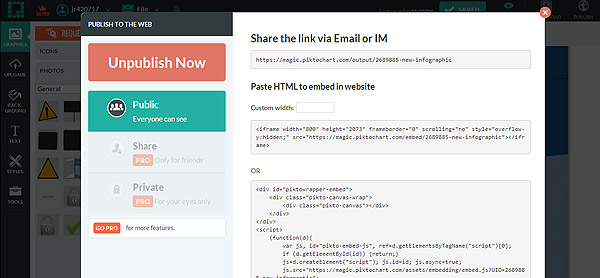
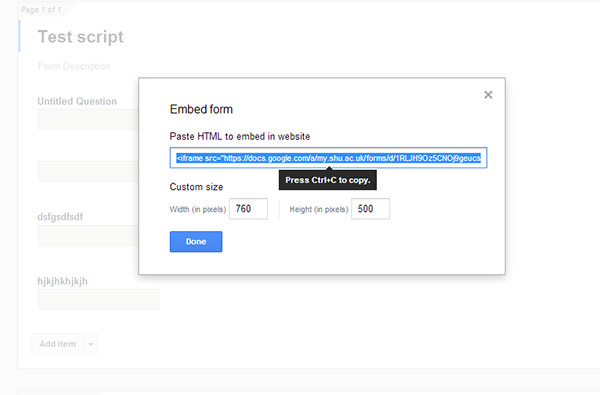
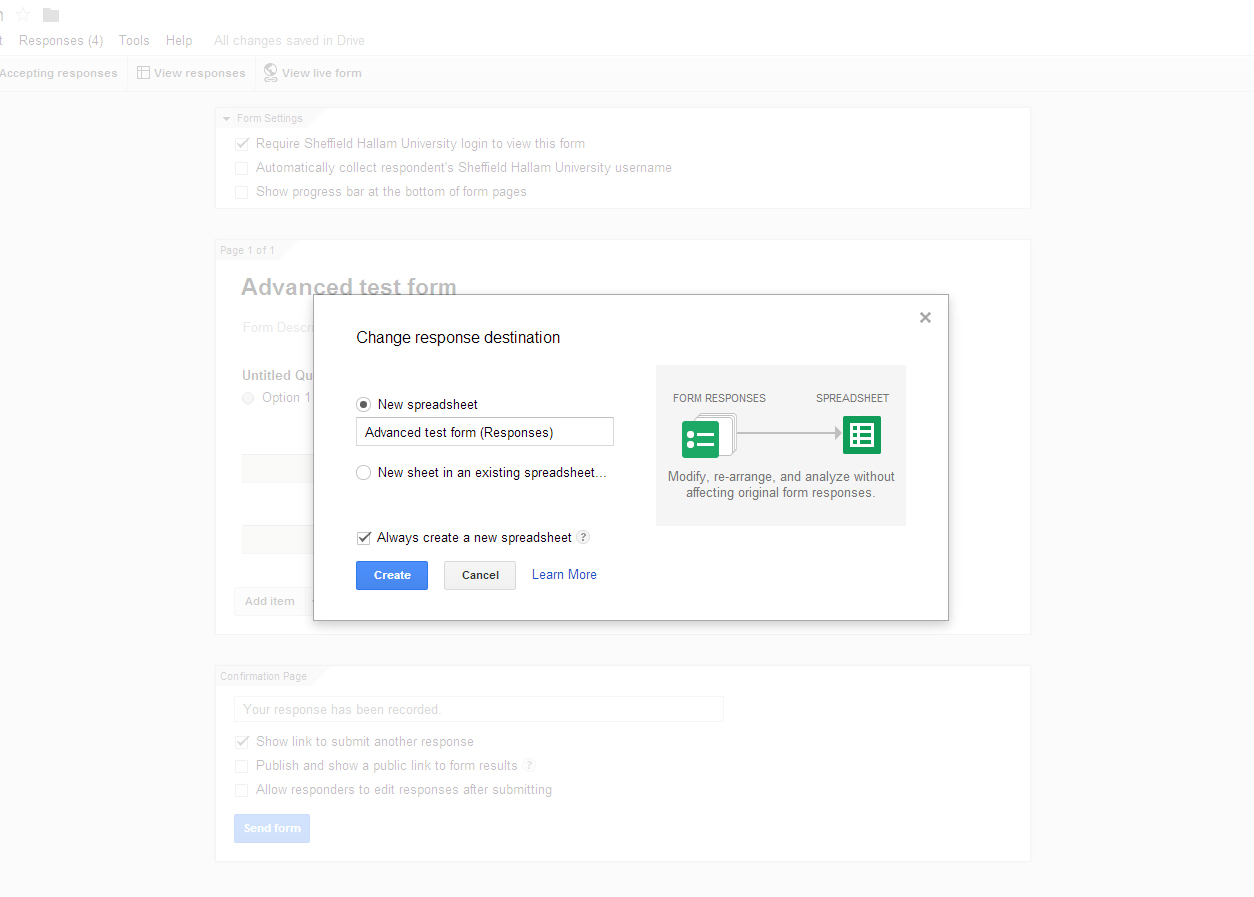
Go back to your Google Sheet and click on ‘File’, in the dropdown select ‘Publish to web’.
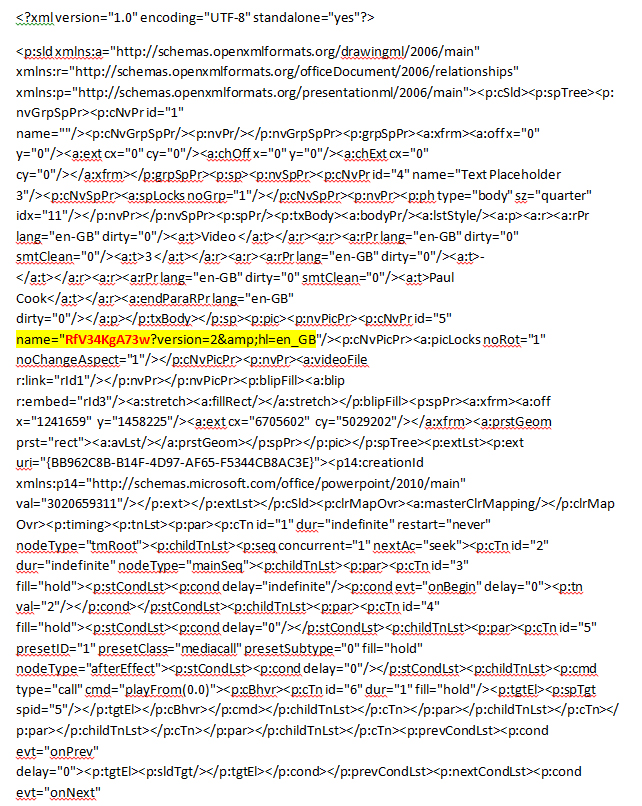
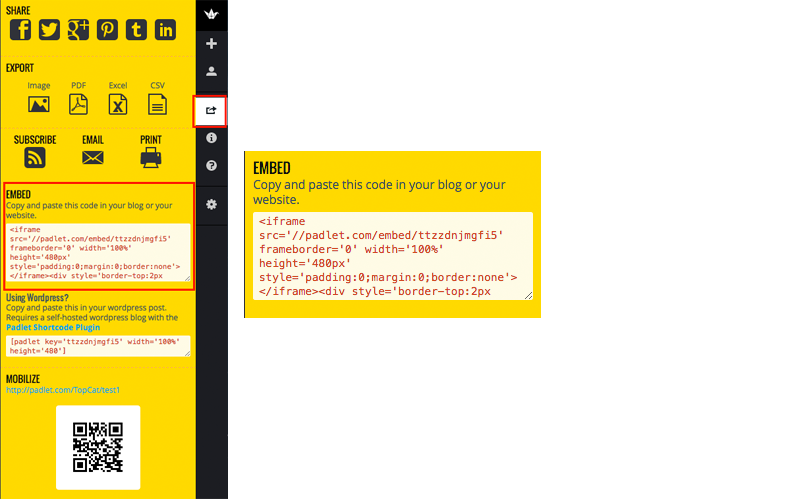
In this dialogue box copy the ‘Document link’ code and paste it in a text editor such as notepad. The code will look similar to that below.
https://docs.google.com/spreadsheets/d/1BgPLV5LIoBe8c2pGwOL_W2XZUhckL-pjEdDPYc3GVmk/pubhtml
The part of the code you will need later is highlighted in red. This is the unique reference code for your Google sheet.
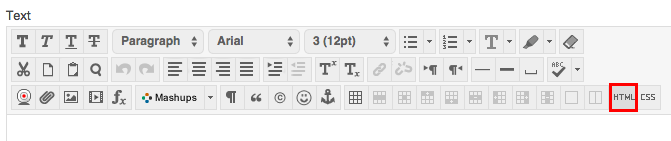
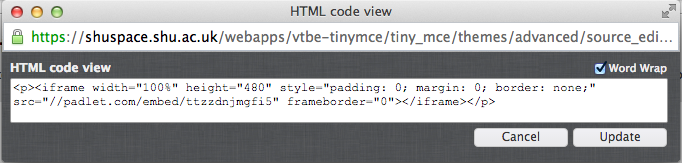
Next, where you wish the database to appear on your page copy in the following PHP code.
<!– CODE STARTS –>
<?php
$search= $_REQUEST[‘search’];
if ($search > ”){ $search = $search;} else { $search = ”;}
?><script type=”text/javascript” src=”http://www.google.com/jsapi”></script>
<script type=”text/javascript”>
google.load(‘visualization’, ‘1’, {packages: [‘table’]});
</script><script type=”text/javascript”>
var visualization;function drawVisualization() {
var query = new google.visualization.Query(‘https://docs.google.com/a/my.shu.ac.uk/spreadsheet/tq?key=1BgPLV5LIoBe8c2pGwOL_W2XZUhckL-pjEdDPYc3GVmk&hl=en_GB’);
query.setQuery(‘SELECT A, B, C, D, E, F, G, H, I, J, K, L, M, N, O, P, Q, R, S, T, U, V, W, X, Y where upper(A) like upper(“%<?php echo $search; ?>%”) or upper(B) like upper(“%<?php echo $search; ?>%”) or upper(C) like upper(“%<?php echo $search; ?>%”) or upper(D) like upper(“%<?php echo $search; ?>%”) or upper(E) like upper(“%<?php echo $search; ?>%”) or upper(F) like upper(“%<?php echo $search; ?>%”) or upper(G) like upper(“%<?php echo $search; ?>%”) or upper(H) like upper(“%<?php echo $search; ?>%”) or upper(I) like upper(“%<?php echo $search; ?>%”) or upper(J) like upper(“%<?php echo $search; ?>%”) or upper(K) like upper(“%<?php echo $search; ?>%”) or upper(L) like upper(“%<?php echo $search; ?>%”) order by A asc label A “Course”, B “Course Code”, C “Department”, D “Course Leader”, E “CL Ext”, F “CL Email”, G “Student Support Officer”, H “SSO Ext”, I “SSO Email”, J “Student Administration”, K “SA Ext”, L “SA Email”, M “Fees”, N “Professional Bodies”, O “Field Trips”, P “14/5 Tgts Home Y1”, Q “14/5 Tgts Oseas Y1”, R “14/5 Tgts Home Y2”, S “14/5 Tgts Oseas Y2”, T “14/5 Tgts Home Y3”, U “14/5 Tgts Oseas Y3”, V “14/5 Tgts Home Y4”, W “14/5 Tgts Oseas Y4”, X “Assessment”, Y “Notes”‘);
query.send(handleQueryResponse);
}
function handleQueryResponse(response) {
if (response.isError()) {
alert(‘Error in query: ‘ + response.getMessage() + ‘ ‘ + response.getDetailedMessage());
return;
}var data = response.getDataTable();
visualization = new google.visualization.Table(document.getElementById(‘table’));
visualization.draw(data, {legend: ‘bottom’});
}
google.setOnLoadCallback(drawVisualization);
</script>
<!– CODE ENDS –>
There are two parts of the code you need to modify. Firstly your unique key needs to be pasted in to the code, marked up in red. Secondly the search criteria needs to be amended to reflect your data and search on the fields you wish to interrogate, marked up in blue.
In my data I have 25 columns A through to Y, all of which are displayed on the webpage and can be searched. You do not have to display and sort all of the fields.
The search code is broken down in to three sections.
(‘SELECT A, B, C, D, E, F, G, H, I, J, K, L, M, N, O, P, Q, R, S, T, U, V, W, X, Y (Selects columns)
where upper(A) like upper(“%<?php echo $search; ?>%”) or upper(B) like upper(“%<?php echo $search; ?>%”) or upper(C) like upper(“%<?php echo $search; ?>%”) or upper(D) like upper(“%<?php echo $search; ?>%”) or upper(E) like upper(“%<?php echo $search; ?>%”) or upper(F) like upper(“%<?php echo $search; ?>%”) or upper(G) like upper(“%<?php echo $search; ?>%”) or upper(H) like upper(“%<?php echo $search; ?>%”) or upper(I) like upper(“%<?php echo $search; ?>%”) or upper(J) like upper(“%<?php echo $search; ?>%”) or upper(K) like upper(“%<?php echo $search; ?>%”) or upper(L) like upper(“%<?php echo $search; ?>%”) (makes columns searchable)
order by A asc label A “Course”, B “Course Code”, C “Department”, D “Course Leader”, E “CL Ext”, F “CL Email”, G “Student Support Officer”, H “SSO Ext”, I “SSO Email”, J “Student Administration”, K “SA Ext”, L “SA Email”, M “Fees”, N “Professional Bodies”, O “Field Trips”, P “14/5 Tgts Home Y1”, Q “14/5 Tgts Oseas Y1”, R “14/5 Tgts Home Y2”, S “14/5 Tgts Oseas Y2”, T “14/5 Tgts Home Y3”, U “14/5 Tgts Oseas Y3”, V “14/5 Tgts Home Y4”, W “14/5 Tgts Oseas Y4”, X “Assessment”, Y “Notes”‘); (adds headers on the spreadsheet)
If your sheet only has 6 columns you would only need
(‘SELECT A, B, C, D, E, F
Likewise
where upper(A) like upper(“%<?php echo $search; ?>%”) or upper(B) like upper(“%<?php echo $search; ?>%”) or upper(C) like upper(“%<?php echo $search; ?>%”) or upper(D) like upper(“%<?php echo $search; ?>%”) or upper(E) like upper(“%<?php echo $search; ?>%”) or upper(F) like upper(“%<?php echo $search; ?>%”)
and
order by A asc label A “Course”, B “Course Code”, C “Department”, D “Course Leader”, E “CL Ext”, F “CL Email”‘);
If you only need to see five of the six columns delete the code relating to that column, such as B in all three parts. Likewise for four, or three etc…
In the third part of the code the text between the quotation marks “xxxxxx” is the text for the headers on each column. This can be edited to reflect your data.
Once you have amended your page upload it to your server (It will not work on a local machine unless it is set up to be a test server). When you update the Google sheet any amends will be reflected on the webpage.
Sorting data from a Google sheet in a webpage – another way
There are other ways to achieve the same result. Instead of using PHP and server-side scripting you can use Twitter Bootstrap and and JQuery to achieve the same result, in fact it displays the data in a better format, especially for data-tables that have only five or six columns.
Once again, this isn’t ideal for a novice as you will need to edit the Javascript in one of the files. The beauty of this code is that you can decide how many rows are displayed on the page, the data will automatically adjust itself as you type in the search box and removing all the text in the search box returns the data to the table, without you having to make a request or refresh the database. An example of what it looks like can be seen below.
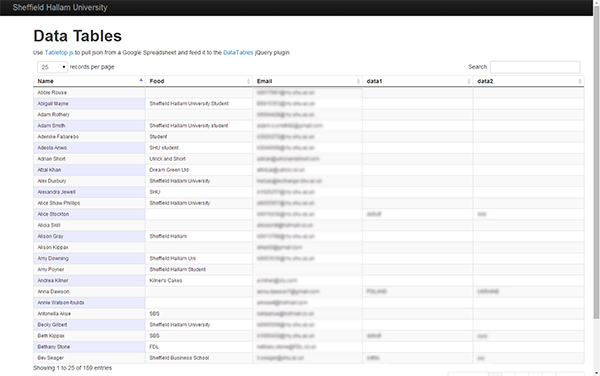
Data displayed in the JQuery table
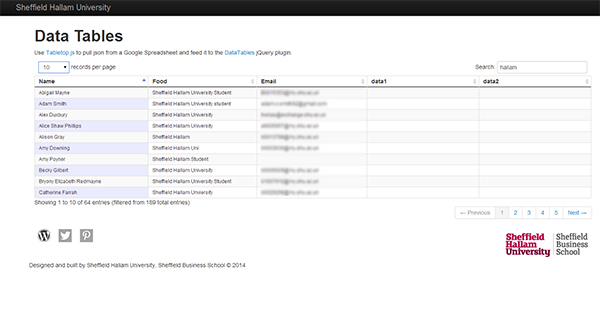
Webpage showing just ten lines of data per page
Alternatively, is this is something you’d like to develop email j.ruffell@shu.ac.uk and we can discuss your requirements.
If you want to give this way a go you can download these source files to see how it works from Github.