Google Forms – Choice Eliminator 2

Do you need a booking system that automatically removes options once they have been chosen?

One way is to use a Google Calendar. How to set up your booking system on Google Calendars can be found here. However, Google Calendars may not be the best solution for you. If you are looking to create short time slots that can be picked, and there may be several options, such as which academic(s) a student may wish to see, then Google Forms with the Choice Eliminator 2 plug-in may be for you.

It is easy with Google Forms to create the necessary framework to get your students to pick which sessions(s) they wish to attend. However, multiple users can also select the same slots, over and over again, leading to many double or triple bookings.

The Choice Eliminator 2 plugin solves this problem by removing an option once it has been chosen. It can also be set up to allow the option to be chosen multiple times, up to the limit you set.


Install the Plugin

The first thing to do is to install the plugin on your Google Form. Once installed it will be available on all the Google Forms you create.

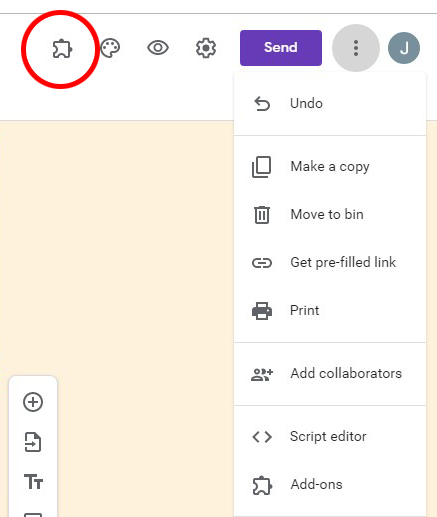
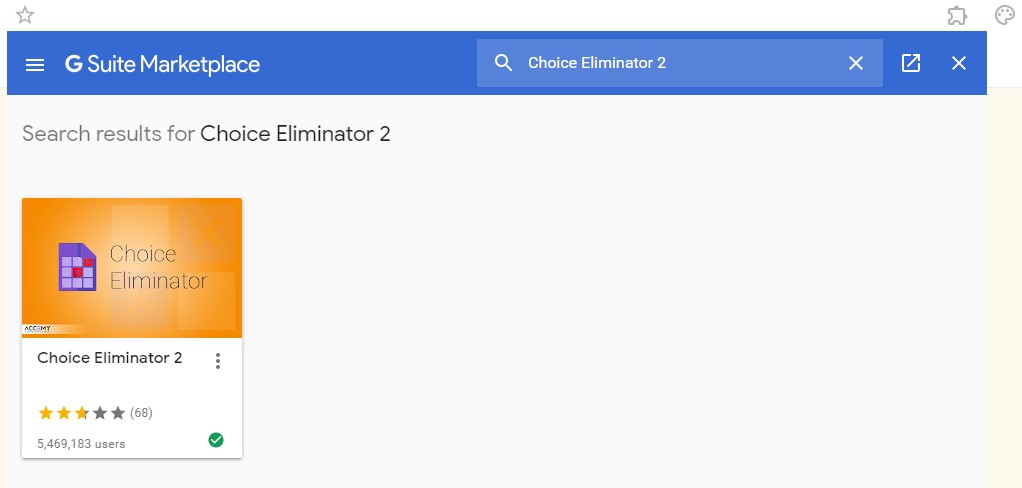
Create a new Google Form and then click on the three vertical dots to the right-hand side of the ‘Send’ button. In here click on ‘Add-ons’ and in the search apps box type in Choice Eliminator. There are two options to pick from. Choice Eliminator 2 and Choice Eliminator Lite. Depending on the functionality you need will depend on which is best for your form.

Installing Choice Eliminator 2

Select your plugin and then click on the box to install it. Once installed, a jigsaw icon will be visible on the navigation bar. Click on this icon to see all the plugins that you have installed. Click on Choice Eliminator 2 to run the plugin on your form. Remember to create your questions before you run the plugin.

Using Choice Eliminator 2

Running Choice Eliminator 2

You will need at least one question in your form with the appropriate question type for Choice Eliminator to run. The developer suggests that you use the drop-down list option for best performance.

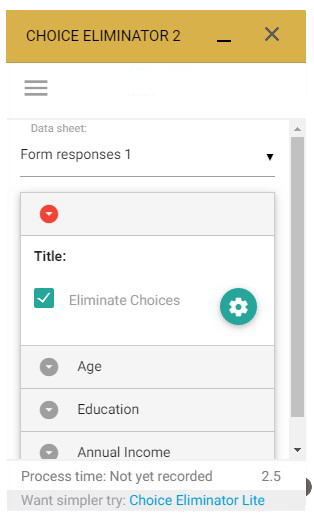
When you run the plugin from the navigation bar it will allow you to configure the settings. You can configure it for each appropriate question you have created. Click on the ‘cog’ to expand the options and to allow options to be selected more than once. Click on the burger menu to ‘add a choice’, find out how many have been picked and to restore the plugin to its default values.

Remember to make sure the ‘Required’ setting is set to off, if users do not have to pick an Adjusting Choice Eliminator 2 settingsoption from this question.
Send the link to your audience as usual to allow participants to select the options applicable to them.

You can create an associated spreadsheet in the normal way to see and filter the responses.

Please note that plugins developed for Google Apps may cease to work if the developer decides to stop updating the plugin. Some functionality may not be available due to lack of access to the ‘Apps’ full code.

Plugins are useful but they should be checked regularly to make sure that they are still working as expected.

Posted in E-Learning | Leave a comment

Digital Exam News

In August 2019, we ran a digital exam with our international summer school students TARUC with resounding success. Francis Awolowo the module leader was delighted by how the exam went and is running more digital exams this semester. The exam consisted of multiple choice questions that were auto-marked, so that students got their results the next day.

The students were encouraged to use their own laptops to take the exams. Prior to the exam, support was given to help students install the software on their devices. They also performed a mock exam to develop their confidence with the new digital format. While the exam was in progress, the software locked down the laptops so the students couldn’t access other websites or applications (although there are options to allow access to specified websites or documents). The invigilators monitored students progress using the software and were able to proactively identify and help students who were experiencing difficulty. Throughout the project, support was provided to academic colleagues and students by the Exams Team, the TEL team and DTS.

A number of other SBS staff are planning to run digital exams for both phase tests and final exams during Semester Two.

Do you want to run a digital assessment?  If so please get in contact the SBS TEL team for further information.


Summary of benefits

For students

  • Students use their own device, which enhances their confidence
  • Students type instead of write by hand. Many students find this easier and the output is more legible for assessors
  • Students can use assistive technologies such as screenreaders with the digital exam software, providing disabled students with a more equitable experience
  • The interface is easy to use and there are a host of features that support effective exam technique
  • Students receive feedback more promptly with auto-marking

 For academic staff

  • The software supports a wide variety of question types. For example, you can ask students to write essays, record audio, create graphs or charts, annotate images, or write formula using mathematical or chemical notation.
  • You can save time, reduce error, and release comprehensive feedback for students in a very short turn around time with auto-marking
  • The interface is easy to use and support is available throughout for you and your students
Posted in E-Learning | Tagged , , | Leave a comment

Why use infographics?

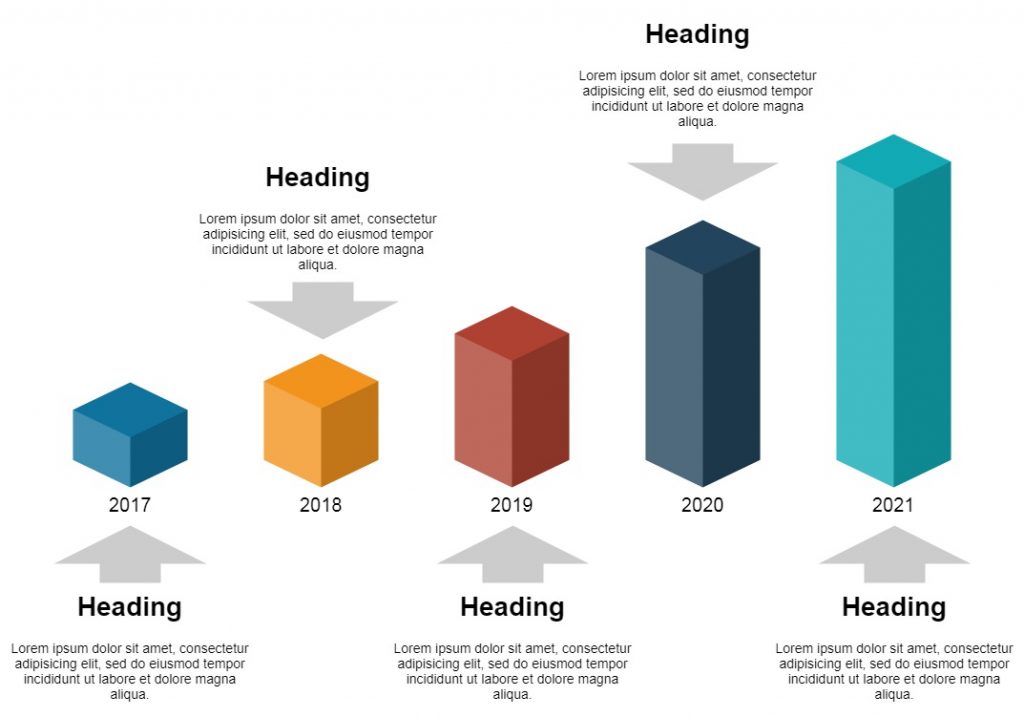
Infographics are a graphical representation of data. They are a great way to display information and to make connections between different statistics. There are several online sites that allow you to create your own infographic which include a range of tools to add charts, pictograms, icons, text and images.

By considering the use of infographics, your practice can become multisensory making your work more accessible for students, peers and whoever else you decide to target. Read more on the benefits of using structured multimedia in learning environments here.   

Infographics for your own work:

Infographics can be used to raise the profile of your research and widen your audience. You could start by demonstrating your results in an infographic format within your academic paper or at a poster event or presentation. Once you have trialled presenting findings in a visual way to peers, you might be inspired for other ways to showcase your research – perhaps to popular media if you would think it is beneficial to a larger audience?

Whether you wish to create an infographic yourself or commision one, you will need a clear idea of what information you wish to display and how would be best to display it. The Journal of Marketing Management has guidance on how you can turn your article into an infographic – click here

Click here for examples of academic infographics.


Infographics for your teaching:

Free tools such as Piktochart, Venngage, Easelly and Canva are easy to use and allows students to create quick infographics to share with the group. A simple seminar activity could be to split the students into groups with a different article to read. At the end of the seminar the students present back an infographic of what the article is about. This demonstrates understanding of the article and gives them experience in summarising information and presenting on a small scale.

Infographics could also be used within assessments including written assignments or presentations. In a written assignment an infographic could enhance a conclusion, action plan or could showcase an individual part of the report e.g. demographics. They could add value to a pitch or VIVA, be it either a formative, summative or as part of a consultancy project module. To assist a pitch the infographic could be comparative, a flowchart or a timeline of events. See the video below for more common types of infographics as inspiration for when you create your first infographic.


Read here for more information on how to use the free infographic tools mentioned in this article. For more information on how to use infographics, contact a member of the SBS TEL team.

Posted in E-Learning, Innovation, Pedagogy | Leave a comment

Using Google Forms to Create Interactive Stories

In an earlier post we saw how you can use Google forms to create quizzes that can give differentiated feedback. It’s here if you missed it: https://blogs.shu.ac.uk/sbstel/2019/02/06/using-google-forms-to-create-quizzes-with-differentiated-feedback/

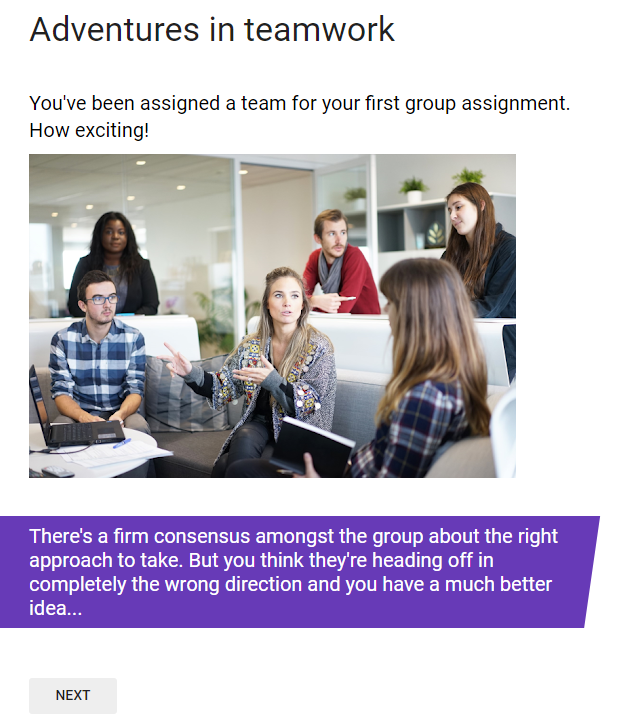
You can use these same principles to create an interactive story or choose-your-own-adventure style game using Google forms. Try this story about teamwork:

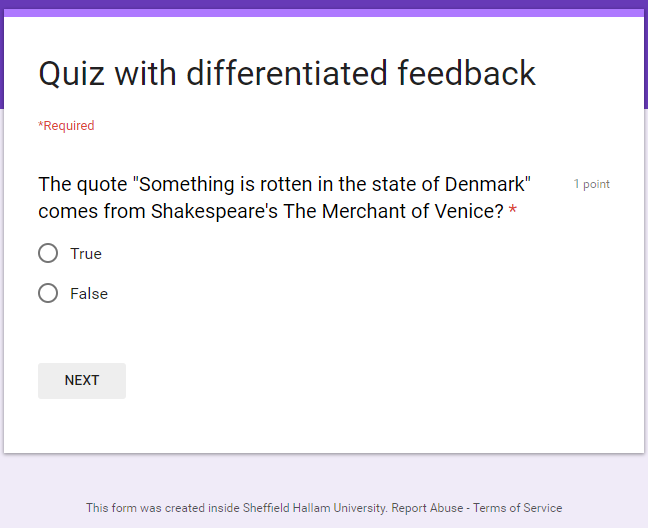
Screenshot of quiz start screen


Here’s how to make your own in 5 steps

Step 1

Map your story out on paper as the branching can get complex quickly.

Step 2

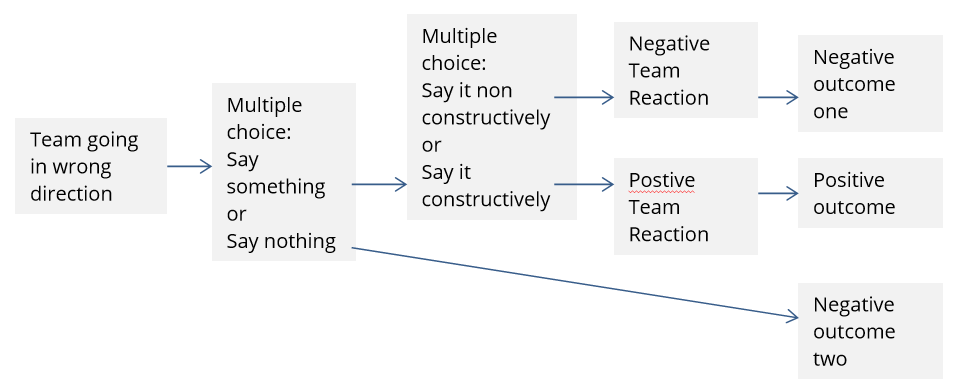
In Google Forms create a ‘new section’ for each distinct piece of content and write your content. This is the teamwork game mapped out, each grey box is a new section.

Flowchart of the teamwork game
Map of the teamwork game

Step 3

Now you have all your sections you can link them up. (You will want to refer to your map at this stage!)

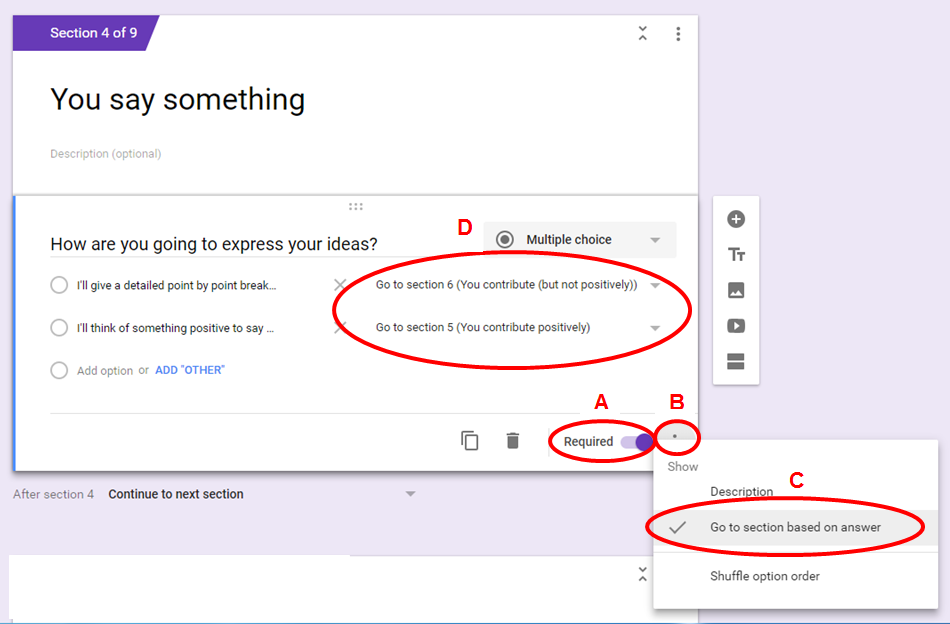
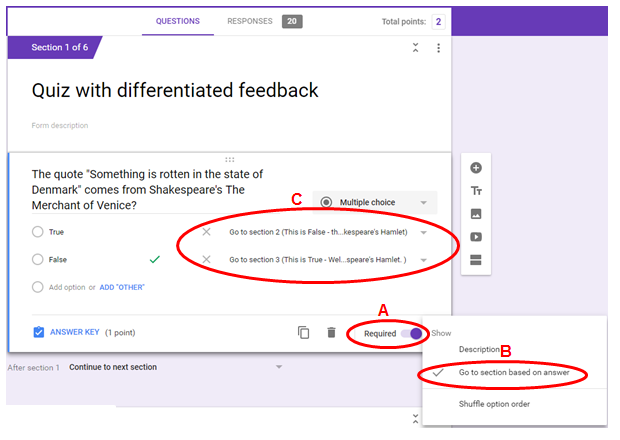
If your section contains  a multiple choice question you create the links like so:

  • Toggle the question to required (A)
  • Go to the three dots in the bottom right of the question field (B)
  • Select  “Go to section based on answer” (C)
  • Dropdowns now appear next to the multiple choice answers so you can choose which section you want to direct the user to based on their answer (D)
Setting up differentiated pathways based on the users response to a multiple choice question

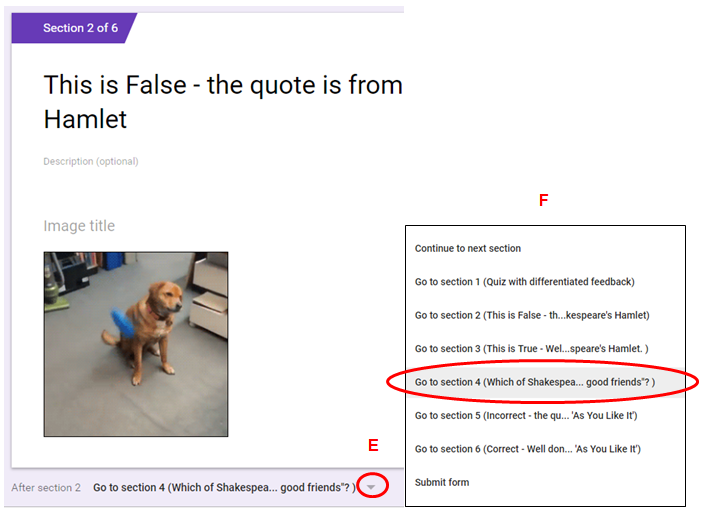
If the section doesn’t contain a multiple choice question it’s more straightforward.  You simply link between sections by clicking the down chevron underneath the section (E) and then choosing the section you want to direct the user to next from the drop down that appears (F).

Setting up non linear pathways

Step 4.

Add  images to each section to illustrate the story – this is what makes it really engaging. You can also embed or link to videos or gifs.

Step 5.

Test your story and make sure it plays as expected.

Posted in E-Learning | Leave a comment

Using Google Calendar to Create Bookable Appointments Slots

Do you need a way for your students to see when you’re available for one to one support and to book appointments with you? You can do this using the Google Calendar appointment slots.

Here’s how it works

You set up the Appointment Slots in your calendar with times, locations, descriptions etc. You share a link to your Appointment Calendar with your students. Students will have to be logged in with their Sheffield Hallam credentials to access the calendar. They can see what appointments are available and book one. Once that appointment is booked, that slot automatically becomes unavailable to other students. Both the student and staff member get email confirmations of the booking and the appointment is entered into your respective Google calendars. The booking will also be entered into the staff member’s Outlook calendar. Students can cancel their own bookings by returning to your appointment calendar or using the link in the email confirmation. You will get notification of the cancellation and the appointment will again become available to other students to book.

How to set it up

Three things you should know

Firstly, your calendar and your appointment calendar are linked but not the same. When you share the link to your appointment calendar with students they can only see the appointment slots you’ve set up. They can’t see any other type of entry in your calendar.

Secondly, the link that you share for bookings will be the same for all and any appointments that you set up in that calendar. If you need to set up appointments for students from different modules you should create a new calendar for each of your modules. This will prevent students from one module booking onto appointment slots intended for students from a different module.

Finally, when a student makes a cancellation, you will get a cancellation email to notify you, however the declined appointment will remain in your Outlook calendar unless you delete it manually.


Posted in Google Apps, New features | Leave a comment

Using Google Forms To Create Quizzes With Differentiated Feedback

You probably know that you can make a quiz using Google Forms but did you know that you can give students differentiated feedback based on how they answer the questions?

Take this quick quiz about Shakespeare plays a couple of times and see what happens when you get the answers right and when you get them wrong.

Quiz Start Page

The gifs used in this quiz as visual feedback were sourced from Giphy. You will probably want to give written feedback instead but it’s worth remembering that you can also embed video feedback or image feedback for added engagement.

How do you make one?

Step 1

Create your quiz questions and answers in Google forms. Each question must be in a new section. You must use multiple choice type questions or dropdown questions.

Step 2

Write your feedback up in Google Forms. Each piece of feedback must be in a new section.

Step 3

Link the answers to the relevant piece of feedback like so:

  • Toggle the question to “Required” (A)
  • Go to the three dots in the bottom right of the question field (this is obscured in the screenshot)
  • Select  “Go to section based on answer” (B)
  • Dropdowns now appear next to each of the multiple choice answers so you can choose which feedback section you want to direct them to next based on their answer (C)

Google forms screenshot

Step 4

Your quiz will probably contain more than one question. So finally you have to link each feedback slide to the next question in the sequence. To do this:

  • click the down chevron underneath the feedback section (E)
  • choose the question that you want to send the user to next from the drop down that appears (F).

Google Forms Screenshot

Posted in E-Learning, Google Apps, Pedagogy | Tagged | Leave a comment

Blackboard Collaborate Ultra

You can use the new features in Blackboard Collaborate Ultra (released Summer 2018) to enhance the interactivity of your online teaching practice.

What can you do with Collaborate?

  • Share your video and audio live
  • Share files such as powerpoint presentations or documents
  • Share your screen to live demo websites or to show an application on your computer
  • Run polls for students to vote in
  • Create breakout rooms where students can work together in small groups
  • Students can interact with you and each other via chat, video and audio, and by sharing files, depending on the permissions you give them

You can see a quick tour of the interface here:

Further resources to help you and your students get started with Collaborate can be found in ‘Tools and Tips’.

Posted in Blackboard, E-Learning | Tagged , , | Leave a comment

draw.io

draw.io (https://www.draw.io/) is a quick and simple web-based app to create:

  • diagrams
  • charts
  • layouts
  • mind-maps
  • network diagrams
  • venn diagrams
  • room layouts

…and much more.

an example of a draw.io diagram

Diagrams can be saved directly to your Google or One Drive as HTML files to keep the file size small and exported to your desktop as a .png, .jpg .pdf or .svg file.

You can also embed your diagrams directly in to your Blackboard site using the <iframe> function.

Creating diagrams couldn’t be easier.

Posted in Blackboard, E-Learning | Tagged , , , , , | Leave a comment

Rip to Zip

Have you ever received a PowerPoint presentation, .ppt, .pptx, or show, .ppsx or similar and not been able to listen to the embedded audio? This is usually due to the codecs needed to play the file(s) not being installed on your PC.

The quick, easy way, to access the audio files is to extract them from the presentation and play them separately.

To do this, rename the extension on the file to .zip

Image of a PowerPoint file

The extension is the three or four letters after the full-stop at the end of the file name, for example – PowerPoint Presentation.pptx

In this example change the .pptx to .zip

From: PowerPoint Presentation.pptx to PowerPoint Presentation.zip

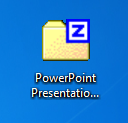
You will be asked if you want to rename the extension, click on Yes. The Icon will usually change to a folder with a Z (for zip) on the right-hand side.

Image of a ZIP folder

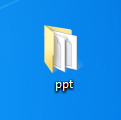
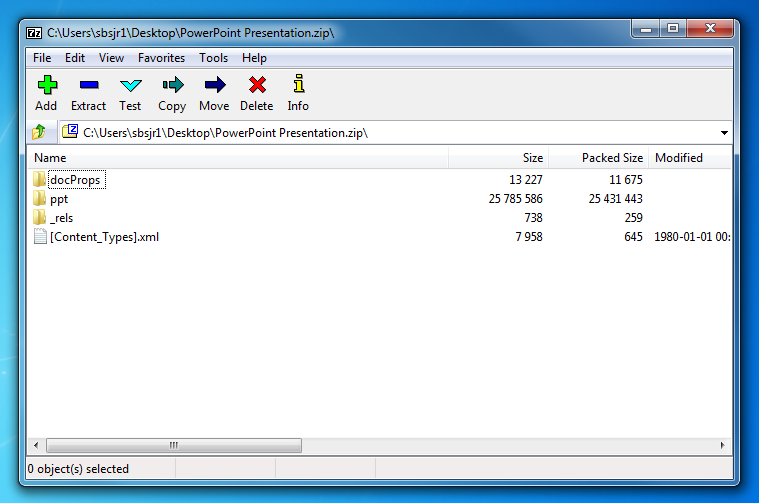
Double click on this folder to open it and drag the ppt folder within on to your desktop.

PowerPoint folder

The file structure of a zip folder

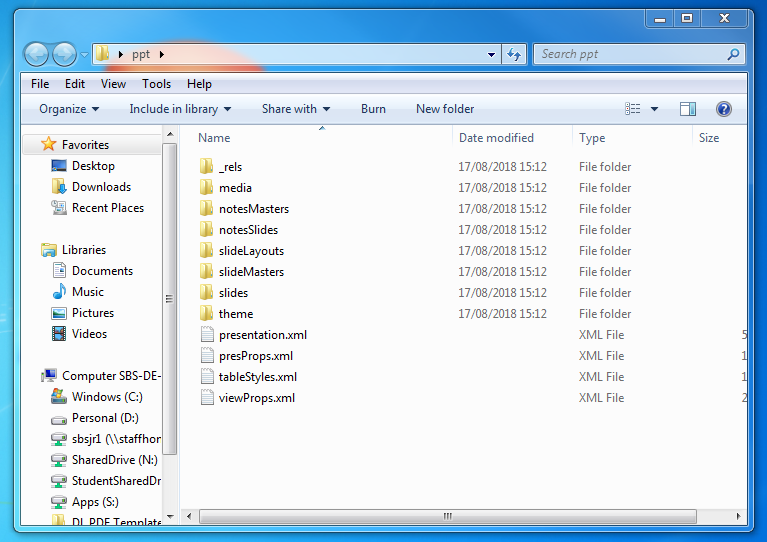
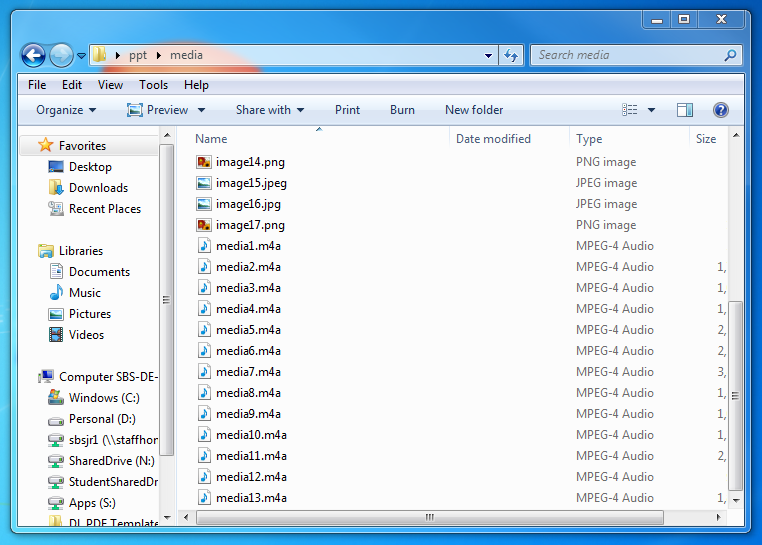
Open this folder and you will see a media folder. Within should be a set of files, images used in the presentation along with the audio files. You can click on each audio files to play them.

Structure of the PowerPoint folderMedia files within the PowerPoint


To convert the zip folder back in to a PowerPoint just change the extension back to its original extension and you can view the presentation as before.

Posted in E-Learning | Tagged , , | Leave a comment

Designing for dyslexia

When creating resources it’s important that the content is accessible to all learners. This article in Design Week has some useful insights in designing for dyslexia.

The style guide (below) is a good starting point.

British Dyslexia Association: Style Guide 2018Creating Dyslexia Friendly Content


All students and staff have access to Acrobat Pro via ‘AppsAnywhere’, the shortcut is on every university desktop.

Acrobat Pro, unlike the normal Acrobat reader which launches automatically when you click on a PDF gives you added functionality which can allow users to re-format documents.

Users can save PDFs as Word Documents to re-format documents to suit their needs if necessary. The Optical Character Recognition (OCR) software also found in Acrobat Pro allows users to convert ‘scanned’ pages back in to text and saved as a Word document. Depending on the quality of the scan the software will do a reasonable job to convert the graphical text in to editable text, which can then be tidied up if necessary.

Posted in E-Learning, New features | Tagged , , | Leave a comment