What Infographics Are – Infographic Labs
This is part of a regular series of articles exploring some of the terms used in e-learning (view other articles in the series). We’ll do our best to break down the jargon and explain what things are from a basic perspective.
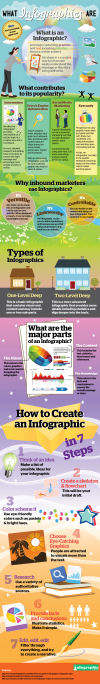
An ‘Infographic’ is a method of presenting information in an engaging, visual way. They have long been used in newspapers, magazines, and books – in fact, there are magazines that base entire articles around infographics (e.g. “How it Works” and “Popular Science“) and books dedicated to them (e.g. “Information is Beautiful” and “The World Reduced to Infographics“). There has recently been a significant growth in their use on-line, possibly as a result of needing to quickly capture the reader’s attention and get them to read the information before they click or scroll away.
Infographics are an effective way to condense complex information and data into a form that can be understood by the non-expert reader. This is typically done by ensuring that the infographic tells a coherent ‘story’ (how Internships have changed over the years or preferences for ebooks vs paper books), as a way of showing the real-world implications behind statistics (how waste plastics affect the sea or major UK events of the 1980s) or as a way of comparing and contrasting (Boeing and Airbus or Left-wing ideas vs Right-wing ideas).
This shows that infographics are an ideal tool for education as they can present factual information in a way that engages the reader and encourages them to find out more. They could be created by lecturers to provide an overview of a topic for students, as a way of creating conference posters or could be produced by students as part of an assessment. Making infographics available to the public is also a great way of raising awareness of a topic and promoting your work to peers, journalists and prospective students.
Creating Infographics
While infographics can be created by hand or using drawing software on a computer (e.g. Adobe Illustrator or Photoshop [free design kits]), most people do not have the time or skills to do this. There are websites that fill this gap by making it easy to produce high-quality results – typically by selecting a template design and modifying it with new graphical elements and text. These include:
However, these tools only help with creating the infographic and won’t help with generating ideas or ensure that the infographic is effective. Before you start designing it is a good idea to plan out the information that you want to include and think about how best to tell the overall ‘story’.


Pingback: What is a MOOC? | e-learning at Sheffield Hallam
Pingback: Why Use Images? | e-learning at Sheffield Hallam
Pingback: Micro-research: An Approach to Teaching and Learning | e-learning at Sheffield Hallam
Pingback: Why Use Images? | Technology Enhanced Learning at SHU