What counts to teachers in literacy classrooms

This is an exhibition of postcards from a British Academy funded research project, Doing Data Differently.
In the current climate, discussions about data in schools are usually linked to pupil attainment, data are represented using charts and graphs, and teachers rarely initiate data collection themselves or use it for their own purposes. The widespread use of attainment data in schools has been widely criticised for its impact on the curriculum, on teaching and learning, and on teacher and pupil wellbeing.
This project set out to do data differently.
Inspired by Dear Data, the project explored how quantitative data might be used in creative, imaginative and personalised ways to find out about primary teachers’ everyday experiences of literacy teaching.
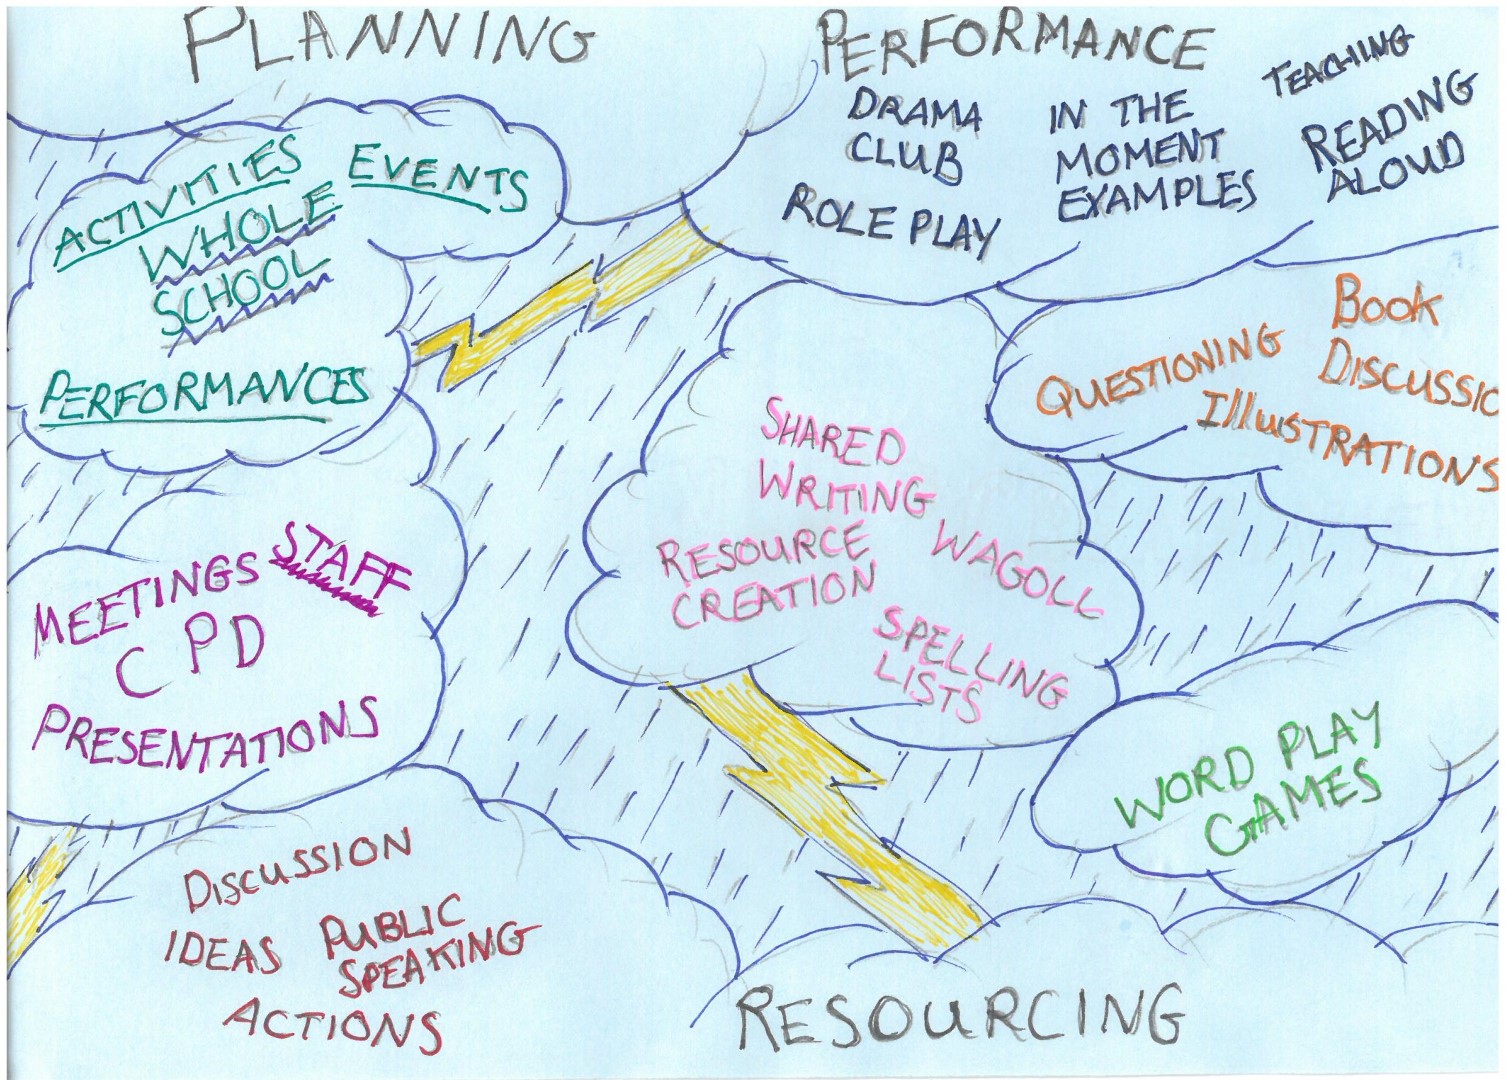
Primary teachers were invited to choose aspects of literacy teaching that were important to them, collect data on those aspects, and find ways of representing the data on postcards which were discussed at half-termly meetings.
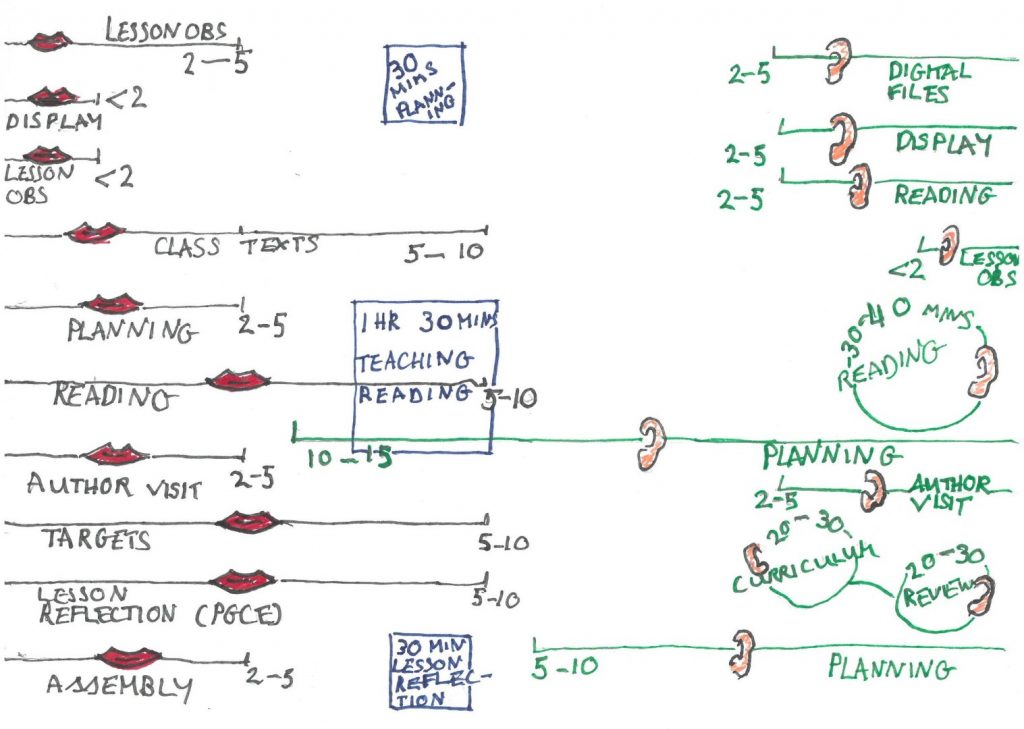
Initially we tried to focus on counting or measuring aspects of practice, but teachers found that it was not always easy to count or measure the things they felt were important. Their postcards provide insights into aspects of literacy teaching that are significant to them. They also raise questions about what might happen - to teachers and to teaching - if data in schools started to look and feel rather different.
We invite you to browse the exhibition for an insider’s view on what it is like to teach literacy and the kinds of things that matter to primary teachers in their day-to-day literacy teaching.
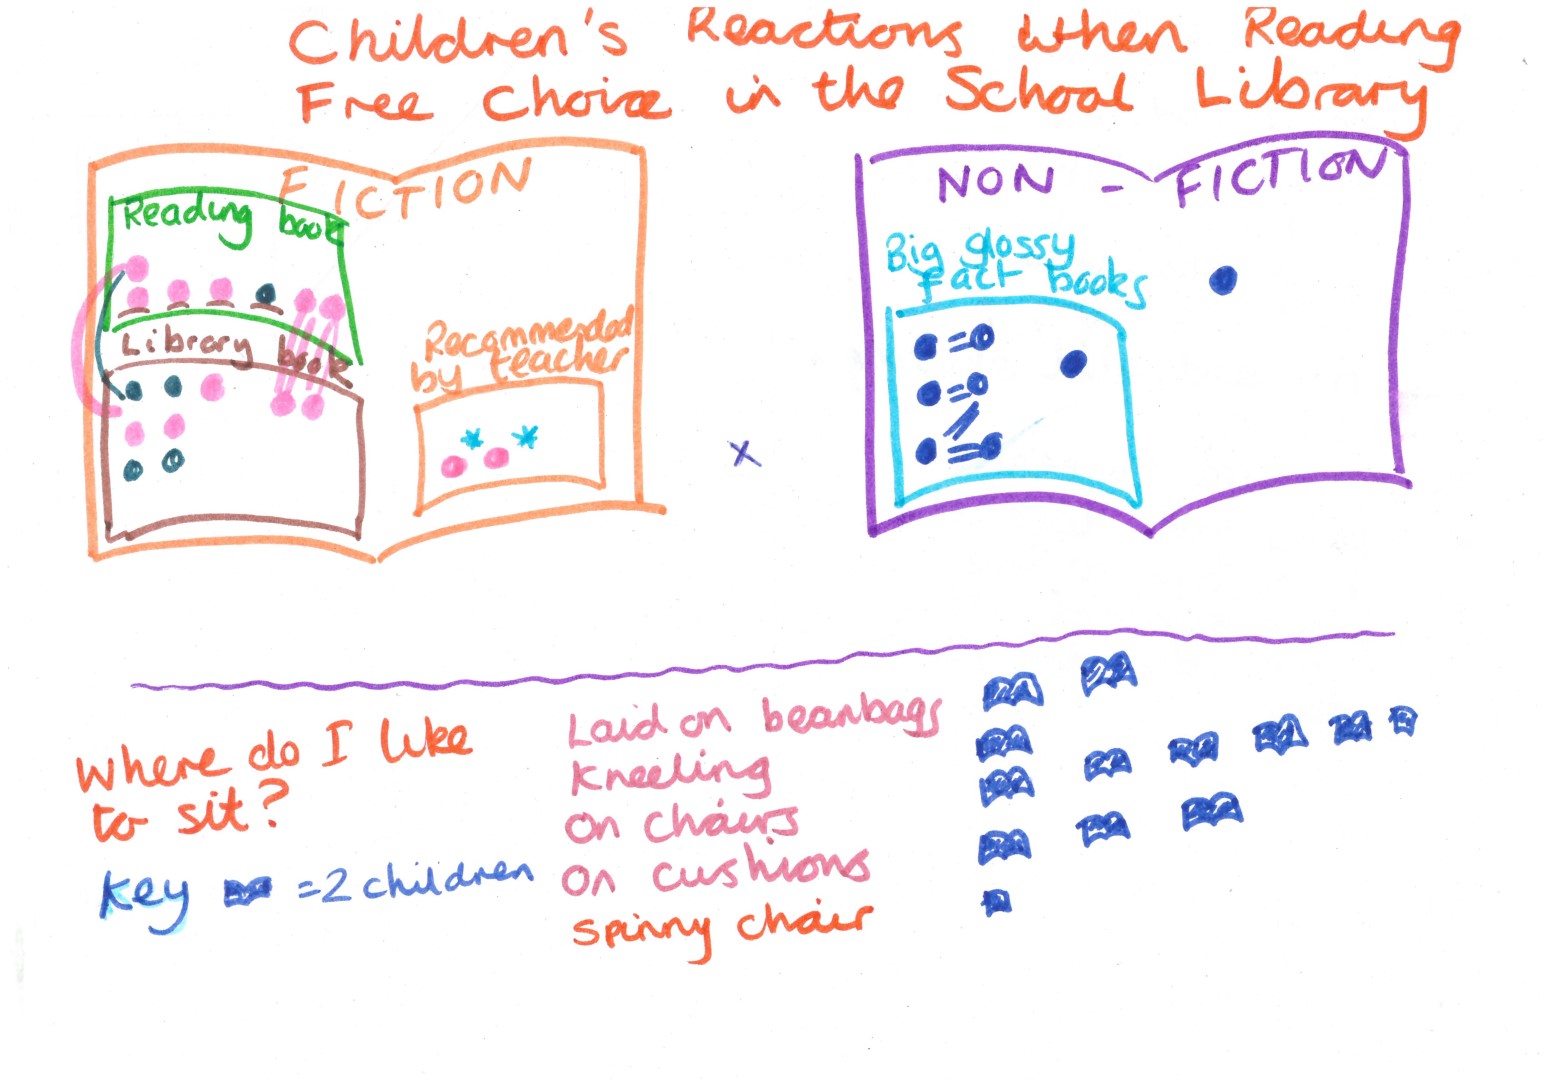
Most of the postcards are 2 sided. The data representation is one side. The other side has a key that explains how to interpret the data representation.
-
MEETINGS
Prior to each meeting, the group agreed a prompt as the starting point for making postcards. Prompts were open-ended to allow teachers to focus on topics or aspects of their practice that were personally significant to them. Sometimes individuals chose to focus on something completely different.
October 2018 – Reactions to…
November 2018 - Where do people or things go?
February 2019 - Creativity and literacy
March 2019 – Teachers’ experience of…
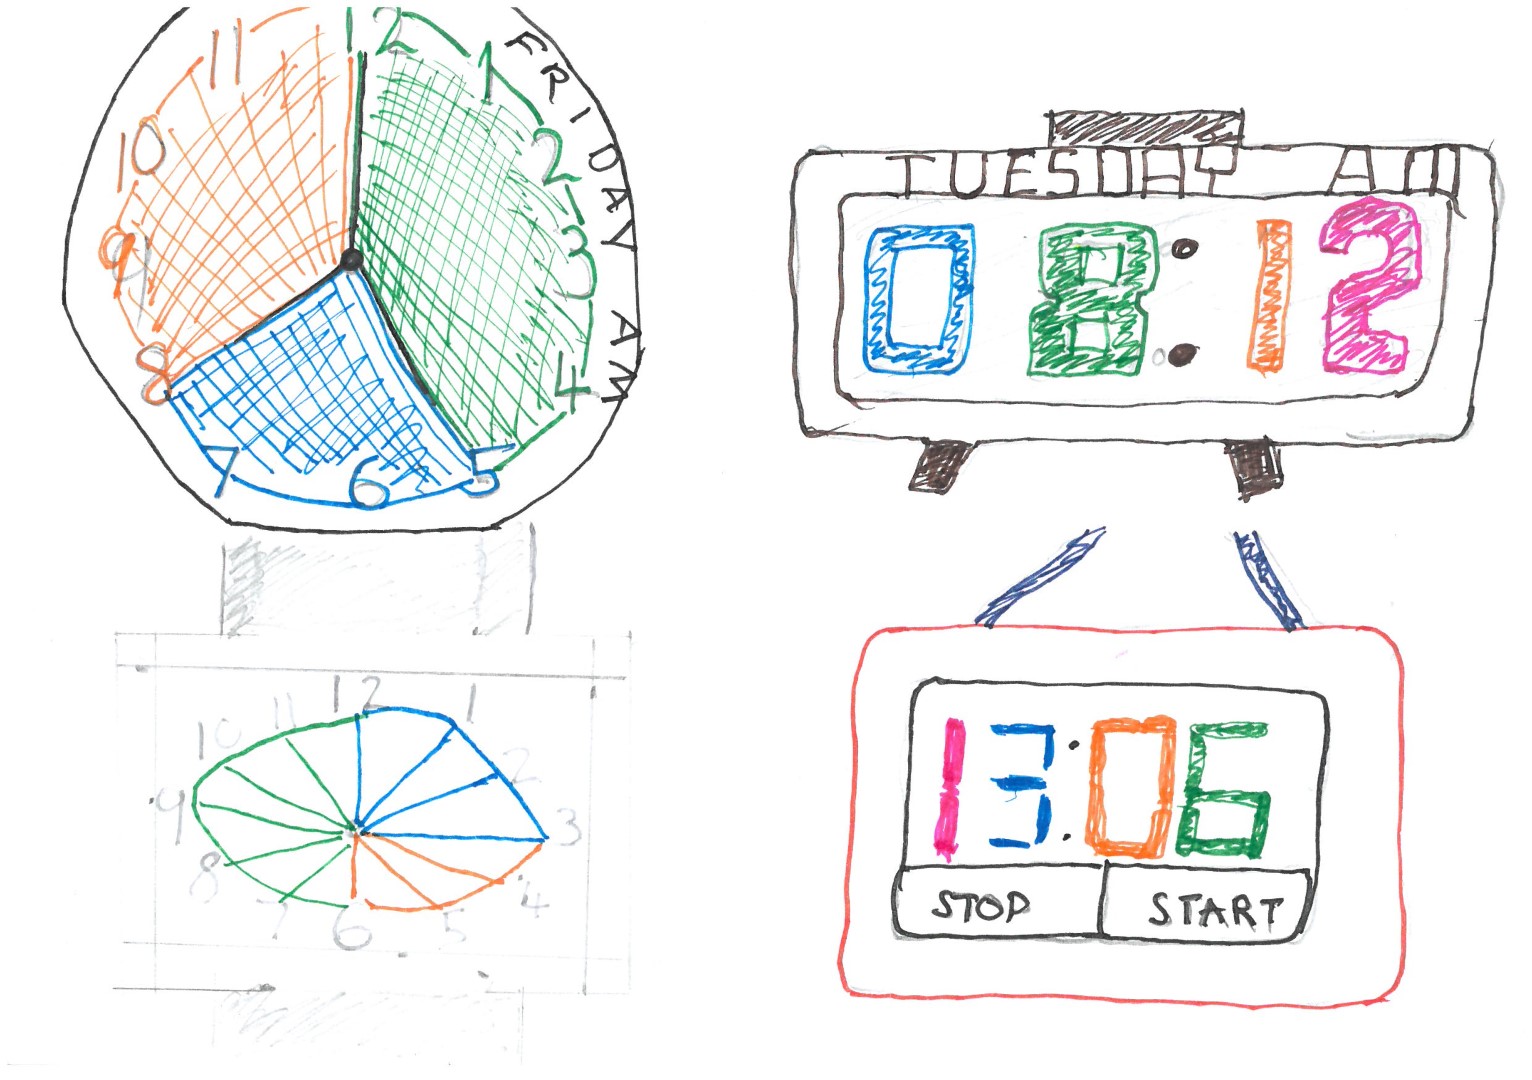
May 2019 - Time spent across a 7 day week mapped against feelings
July 2019 - Open-endedTeachers chose anything that was important to them that they wanted to focus on for their final postcard.
-
-
THEMES
These seven themes represent aspects of teachers’ experiences that they chose to showcase through the postcards.
Curriculum
Feelings
Learner engagement
Movement
People
Places
Planning
Professional life
Resources
PROJECT MEMBERS
Project Participants
A group of seven primary school teachers from across South Yorkshire and North Derbyshire.
Research Team
Professor Cathy Burnett
Professor Guy Merchant
Dr Ian Guest