One thing that we’ve learned from the current pandemic – if we didn’t already know it – is that data can be powerful. And of course, it’s not just data but visualisations of data that make a difference. Just a fortnight ago heat maps of COVID-19 infection in different regions and graphs showing projected numbers of deaths were used to make the case for a second national lockdown in England. No matter that the graphs were so small that you couldn’t read the labels on their axes or that the models on which they built have since been problematised, the spread of red and soaring clines charted an inexorable move towards a breakdown of the NHS and intensified the national crisis.
Of course, those of us working in education have known about the power of data for a long time. Analyses of attainment data and attendance – used to monitor the relative performance of students, teachers, schools and regions – are the touchstone for school accountability. This creates pressure not just to make a difference to students in our schools- but to make a difference to the data, pressure which- as various studies have shown- have has significant impacts on the breadth and scope of the curriculum, on the kinds of professional decisions teachers feel able to make, and on the health and wellbeing of teachers and their students. One of the problems here is that teachers rarely initiate data collection themselves or use it for their own purposes – so data become something that is done to teachers rather than something they do themselves. This means that data tell stories about what happens in schools that miss much of what goes on.
There have been many calls to rethink this dependence on attainment data, as reflected in the most recent Ofsted framework. But attainment data is now so embedded in the way we think about progress- whether this is progress by students or progress by schools- that it can be hard to think radically about how else we might ‘do’ data.
One response to this was a British Academy funded project- Doing Data Differently– through which Guy Merchant and I worked with seven primary teachers who collected their own data in order to communicate alternative stories about teaching. The teachers chose aspects of literacy teaching that were important to them, collected relevant data and represented these on postcards that were discussed at half-termly meetings.
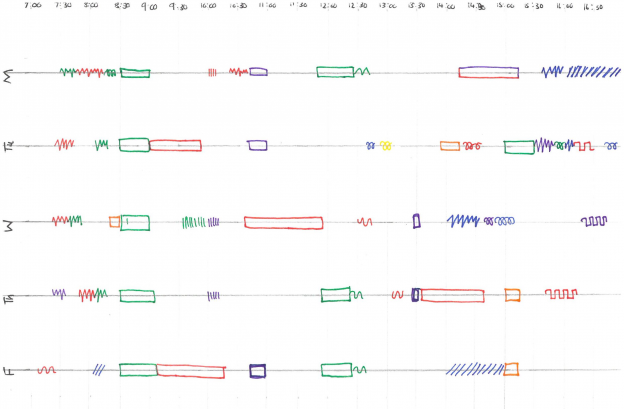
Inspired by Georgia Lupi and Stefanie Posavec’s Dear Data, the teachers played around with different ways to visualise their data. Shunning the idea that the best kinds of visualisations are those that communicate general trends easily and quickly (like the COVID-19 graphics for example), they embraced the idea that data could be small (personal and impressionistic) and slow (requiring time to interpret and reflect).
The results can be found in our virtual exhibition, which features the postcards alongside teachers’ comments on what the data visualisations mean and why they’re important. They’re an eclectic and colourful collection of hand-drawn visual metaphors, graphs, maps and tally charts which together provide an insider’s view of what it is like to teach literacy and the kinds of things that matter to primary teachers in their day-to-day teaching. We hope that it will be visited by all kinds of people, by those considering a career in teaching or just starting out, or by anyone that just wants to know a bit more about what it’s like to be a teacher.
Most importantly perhaps, the teachers told us that they valued the experience of creating and sharing postcards as a chance to focus on what mattered to them, to share their experiences with other professionals in a non-judgmental environment, and as a way of reflecting and reviewing their own literacy teaching.
Doing Data Differently was a small exploratory project involving just a few teachers but it does, we believe, speak to important questions about the role of data in schools, questions explored during an online colloquium held this week to launch the exhibition. It provides an example of what can happen if teachers are encouraged to collect, visualise and share their own data and if the power of data is handed back to them.
If you would like to know more about Doing Data Differently or would like to get involved in a future project to explore new possibilities for data in schools, please contact Cathy Burnett at c.burnett@shu.ac.uk.
Written by Cathy Burnett, Professor of Literacy and Education, Sheffield Institute of Education
Leave a Reply